Analytics Dashboard
Overview
The Analytics Dashboard is a graphical information dashboard for Administrators that provides an overview of user activity for a tenant. Administrators can view information for the current day, last 7 days, last 30 days, or by selecting specific dates.
Navigation
To access the Analytics Dashboard, follow these steps:
- Log in to a tenant as a community administrator.
- Navigate to the ** Dashboard** menu and click Analytics.
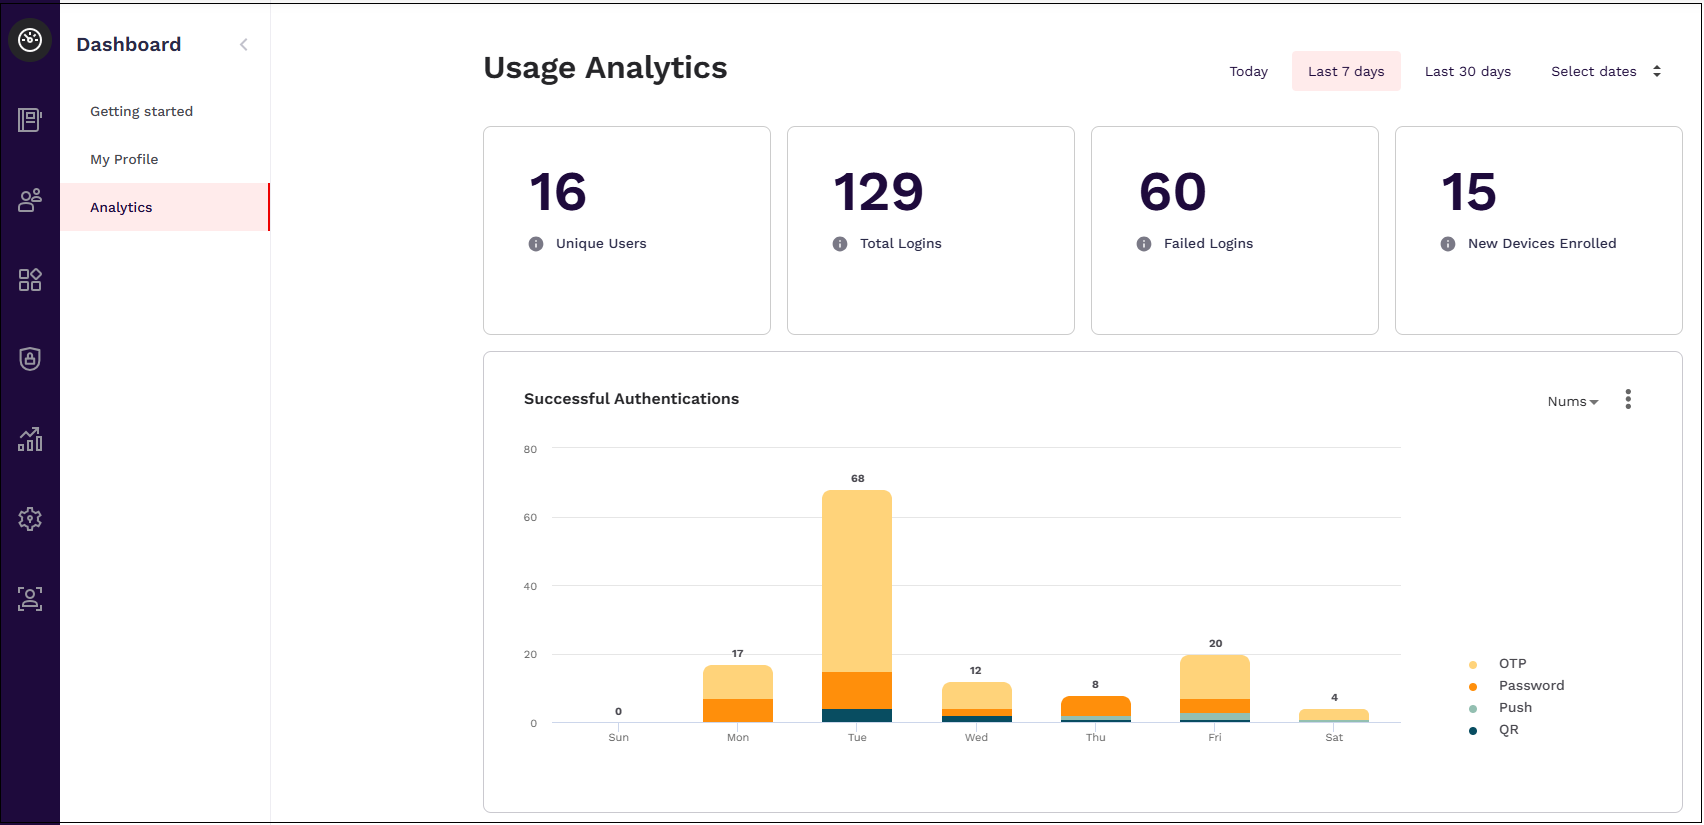
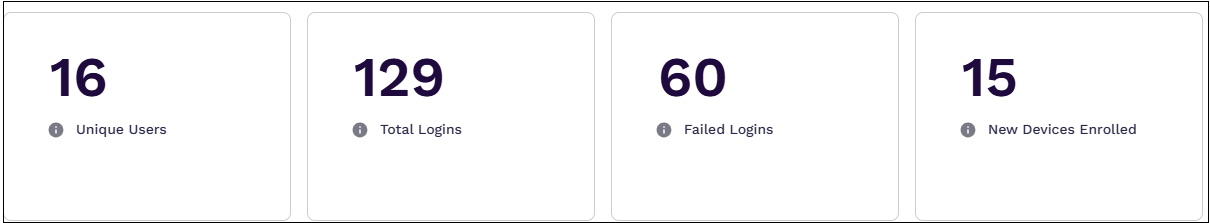
Total Numbers
From the top, Administrators can see the number of:
- Unique Users
- Unique users with at least one authentication
- Total Logins
- Total number of logins across all applications using any login method
- Failed Logins
- Number of failed login attempts from users
- New Devices Enrolled
- Number of devices enrolled
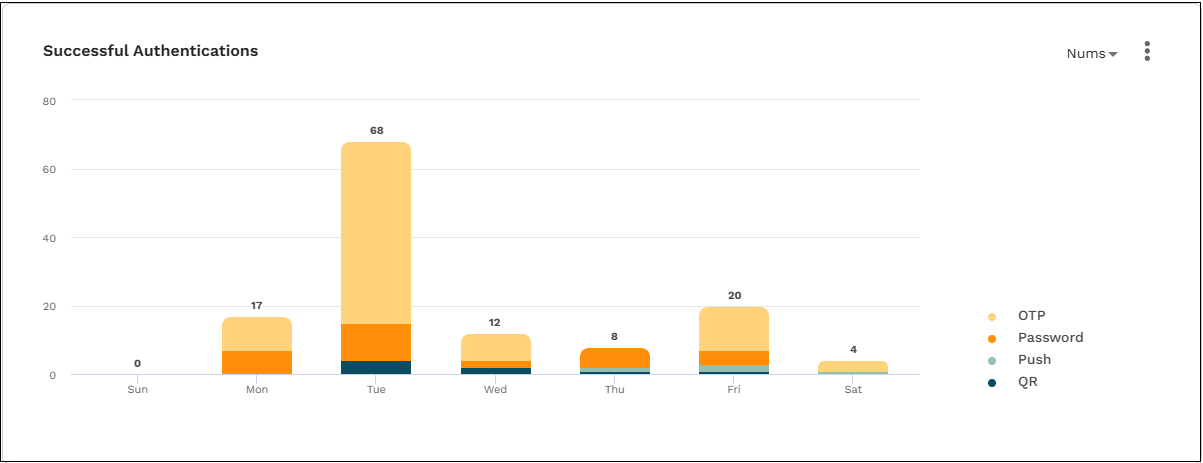
Successful Authentications
This chart displays the number of successful authentications and the authentication method used for the listed dates. Users can switch the view from numbers to percentage from the drop-down menu near the upper-right of the graph.
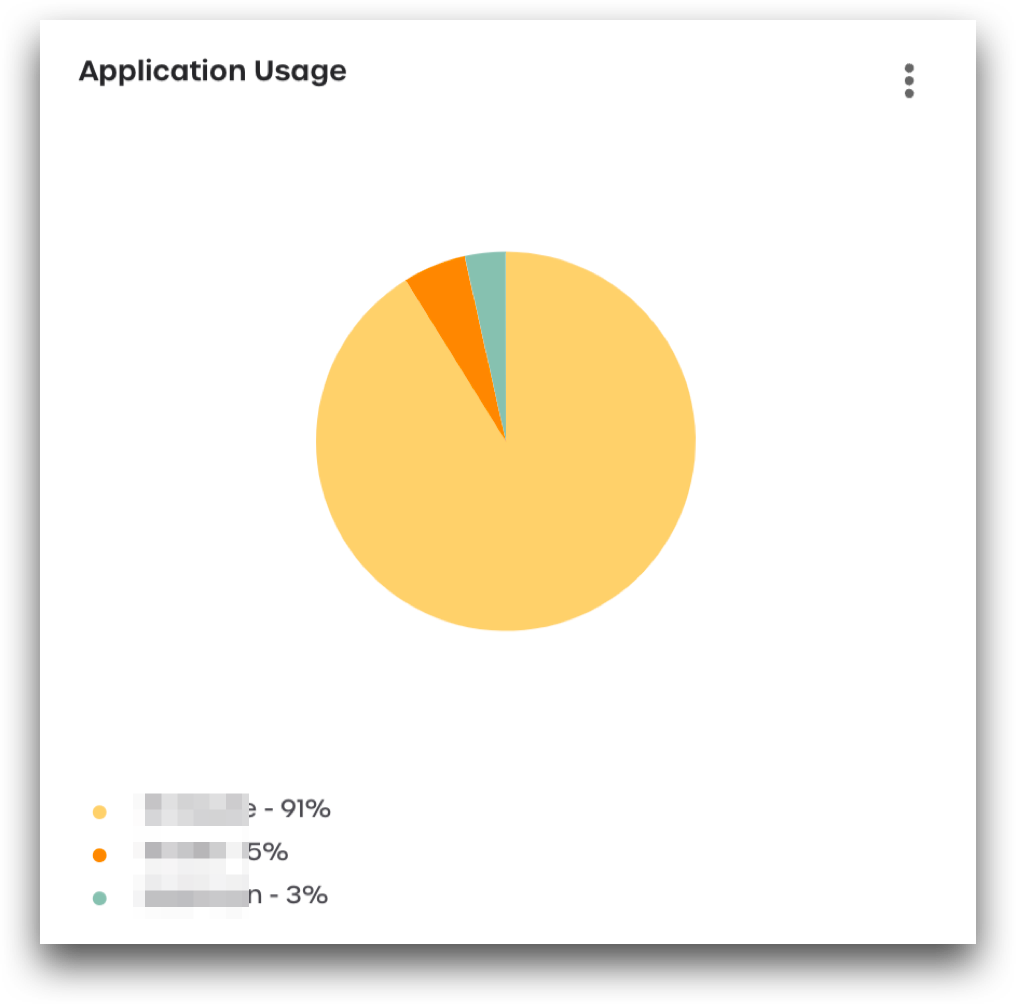
Application Usage
The graph on this page displays the total number of logins to the SAML and OIDC applications displayed.
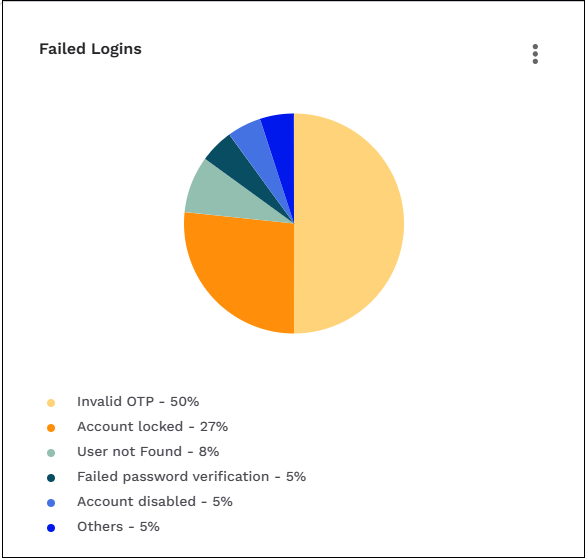
Failed Logins
This graph displays the number of failed logins, as well as the reason the login failure.
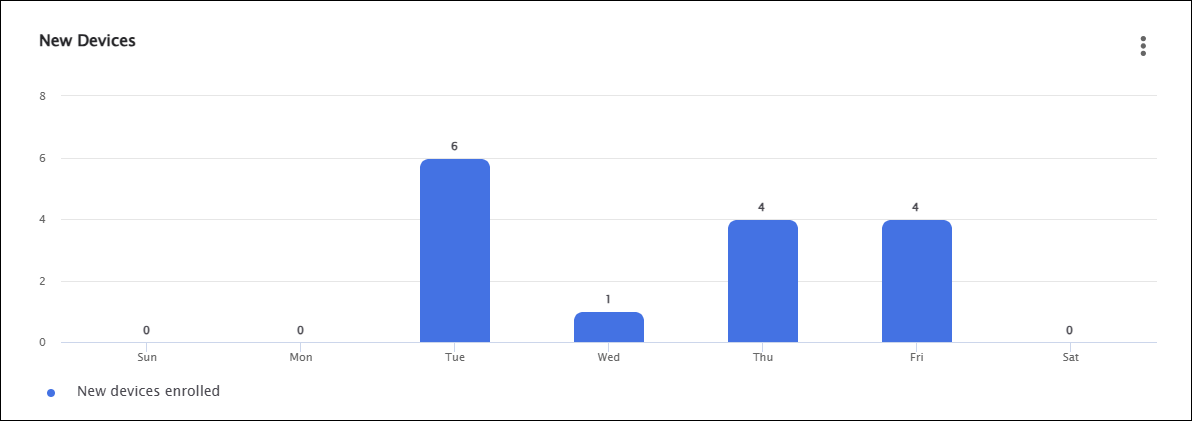
New Devices
This graph displays the total number of new devices for each listed date.
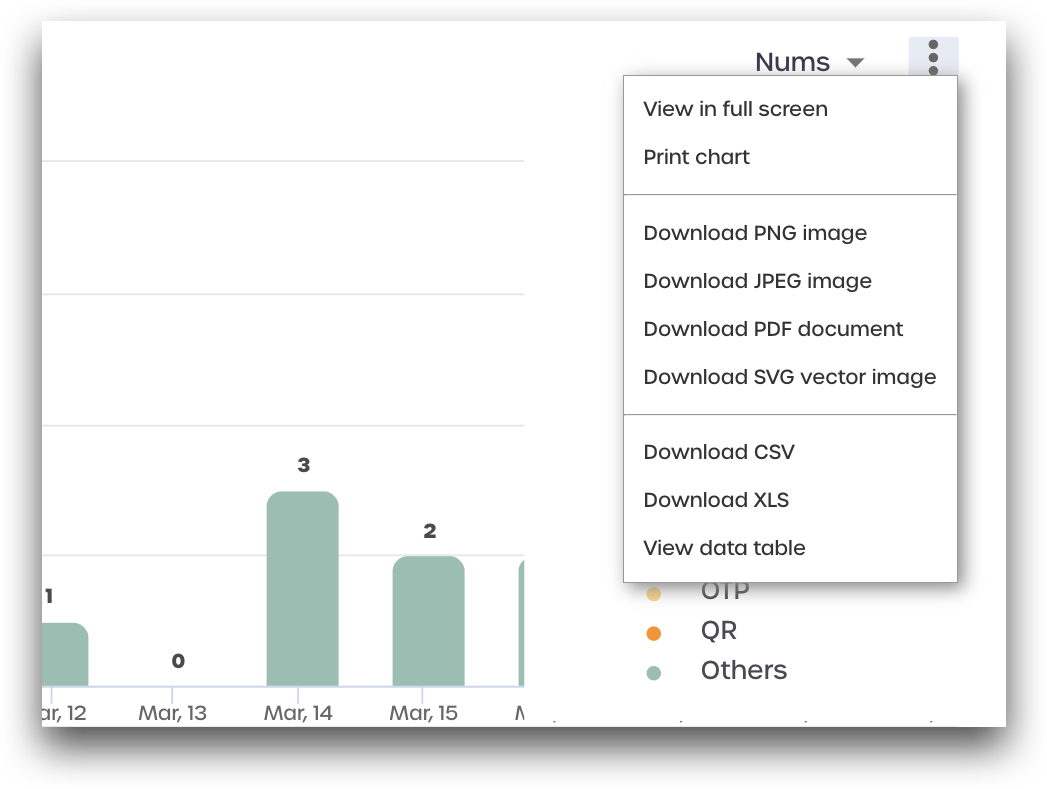
Download, Export, or Print Analytics Information
Each displayed graph has a menu that can be used to download as an image in a variety of formats, and the data displayed in the graphic can be extracted to tables. Users can also view the graph on full screen or print from the menu.
Click the three-dot hamburger menu located in the upper-right corner of each graph to open the menu. Select an option to view, download, or print the displayed data as desired.